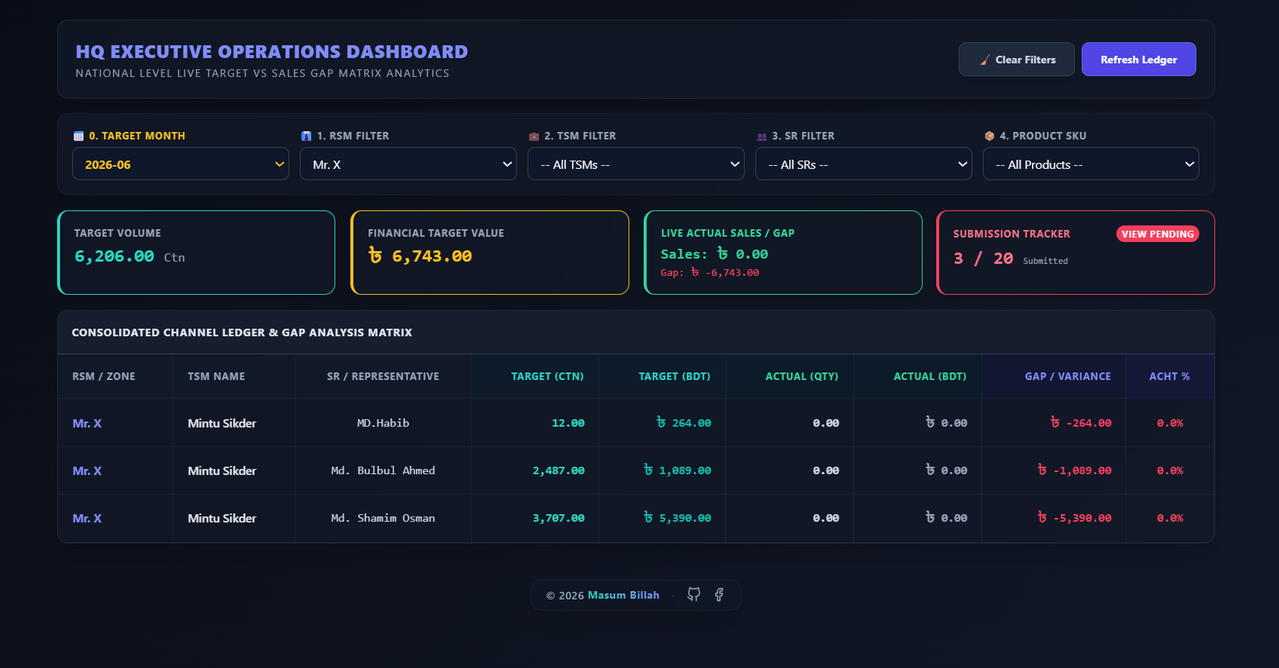
A cloud-based sales target management and analytics platform built with Google Apps Script and Google Sheets. The system enables hierarchical target submission, sales performance tracking, gap analysis, KPI monitoring, and executive-level reporting across TSM, RSM, and Head Office teams.
Md. Masum Billah··3 min read
"""
Building a centralized sales target management and performance analytics
platform using Google Apps Script, Google Sheets, and a custom business
intelligence dashboard.
Executive Summary
PT Consumer Products Industries required a centralized system for
collecting monthly sales targets, monitoring field performance,
tracking reporting compliance, and analyzing sales gaps across
multiple regions.
To solve this challenge, I designed and developed a cloud-based
Sales Target & Gap Analytics Portal that enables Territory Sales
Managers (TSMs) to submit targets while providing executives with
real-time visibility into organizational performance.
1. Business Challenge
Managing sales targets across multiple territories and field teams
was becoming increasingly difficult through spreadsheets and manual
reporting processes.
Management lacked visibility into target achievement, sales
performance, and submission compliance at both regional and national
levels.
Manual target collection process
No centralized reporting system
Difficulty tracking TSM submissions
Limited performance visibility
No real-time target vs actual comparison
Time-consuming report consolidation
As the organization grew, spreadsheet-driven processes could no
longer support business decision-making effectively.
2. Solution Architecture
I developed a centralized web application using Google Workspace
technologies and a custom analytics engine.
Google Apps Script Backend
Google Sheets Database Layer
HTML & JavaScript Frontend
Tailwind CSS User Interface
Role-Based Authentication System
Dynamic Analytics Engine
The platform serves as a single source of truth for sales targets,
reporting compliance, and performance analytics.
3. Multi-Level User Management
The application was designed with hierarchical access control to
ensure each user only sees information relevant to their role.
Territory Sales Manager (TSM)
Regional Sales Manager (RSM)
Office Users
System Administrators
User authentication dynamically determines which dashboard and
features are accessible after login.
4. Dynamic Target Entry Portal
One of the core challenges was simplifying target submission for
field teams.
Instead of entering data into multiple spreadsheets, TSMs interact
with a dynamic matrix interface that automatically generates target
entry grids based on assigned dealers, sales representatives,
territories, and products.
Auto-generated target matrix
Dealer-wise planning
Product-wise allocation
Territory-level targeting
Historical submission loading
5. Executive Analytics Dashboard
For management, I developed an executive dashboard focused on
performance monitoring and decision support.
Target Volume KPI
Financial Target Value
Actual Sales Performance
Gap Analysis
Achievement Percentage
Submission Tracking
Executives can instantly identify underperforming territories and
take corrective action without waiting for manual reports.
6. Gap Analysis Engine
The most valuable feature of the platform is the Gap Analytics
Engine.
By combining target data with actual sales records, the system
automatically calculates performance variance across every level of
the organization.
Target Quantity
Target Value
Actual Quantity
Actual Revenue
Sales Gap
Achievement Percentage
The dashboard transforms raw sales data into actionable business
intelligence.
7. Reporting Compliance Tracker
A dedicated submission tracker monitors reporting compliance across
all active TSMs.
Management can instantly identify which territories have submitted
monthly targets and which teams require follow-up.
Submission Monitoring
Pending TSM Detection
Compliance Tracking
Real-Time Status Updates
8. Business Impact
The implementation significantly improved operational efficiency and
reporting visibility throughout the organization.
Reduced manual reporting effort
Improved reporting compliance
Faster executive decision-making
Real-time performance visibility
Centralized business intelligence
Scalable reporting architecture
9. Conclusion
The PT CPI Sales Target & Gap Analytics Portal transformed a
fragmented reporting process into a centralized analytics platform.
By combining automation, business intelligence, and cloud-based
technologies, the system now provides both operational teams and
executives with the tools needed to plan, monitor, and optimize
sales performance effectively.
The real value of analytics is not measuring performance — it is
enabling better business decisions.
"""