Optimizing E-commerce Sales Using SQL & Power BI
Turning raw transaction data into actionable insights that drive revenue growth, customer retention, and smarter business decisions.
Executive Summary
E-commerce businesses generate massive amounts of transactional data every day. However, data alone does not create value. In this project, I used SQL for data preparation and Power BI for interactive analytics to uncover sales trends, customer behavior, product performance, and revenue opportunities that support data-driven business decisions.
1. Business Challenge
E-commerce companies often collect thousands of transactions daily, but identifying meaningful business insights can be difficult.
Management needed visibility into revenue trends, customer purchasing patterns, product performance, and profitability across categories.
Data becomes valuable only when it helps answer business questions.
2. Data Preparation with SQL
The first step was transforming raw transactional data into a structured dataset suitable for analysis.
- Data cleaning and validation
- Removing duplicate records
- Handling missing values
- Creating calculated business metrics
- Building analytical views for reporting
SQL enabled efficient querying and transformation of large datasets, creating a reliable foundation for business intelligence reporting.
3. Building the Power BI Dashboard
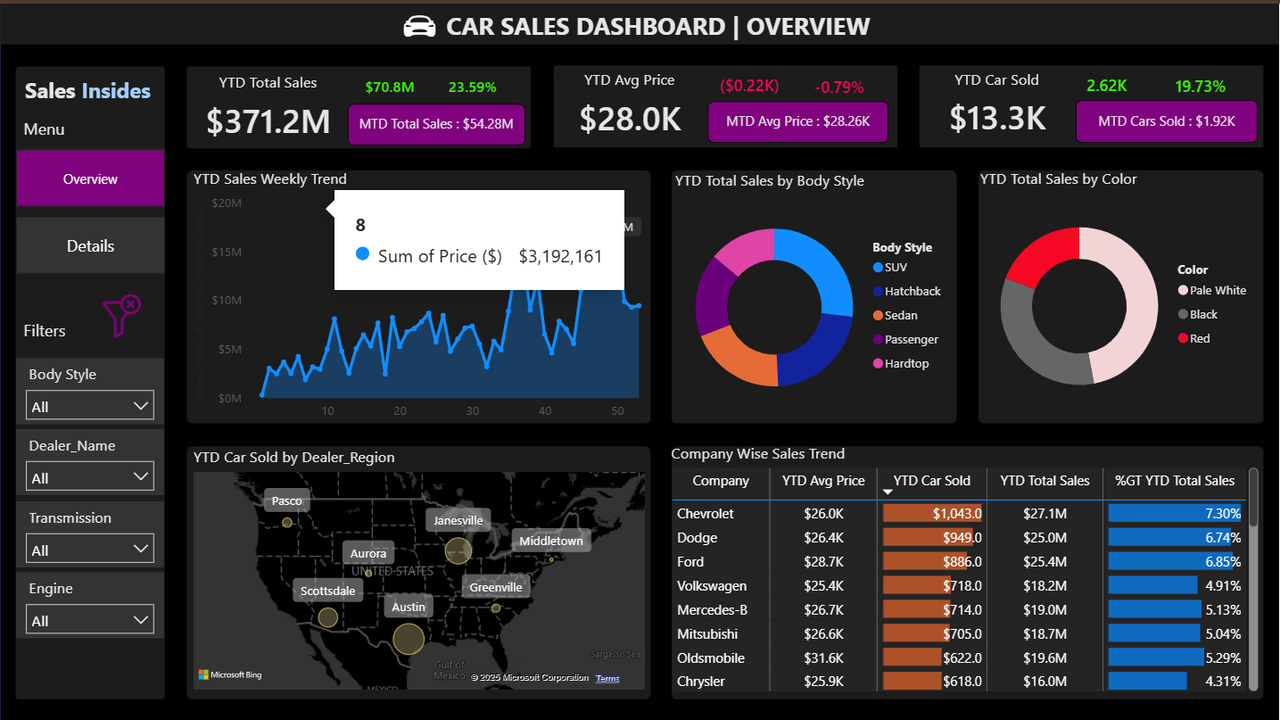
After preparing the data, I developed an interactive Power BI dashboard that provides stakeholders with a comprehensive view of business performance.
- Total Revenue Analysis
- Profitability Tracking
- Sales Trends Over Time
- Top Performing Products
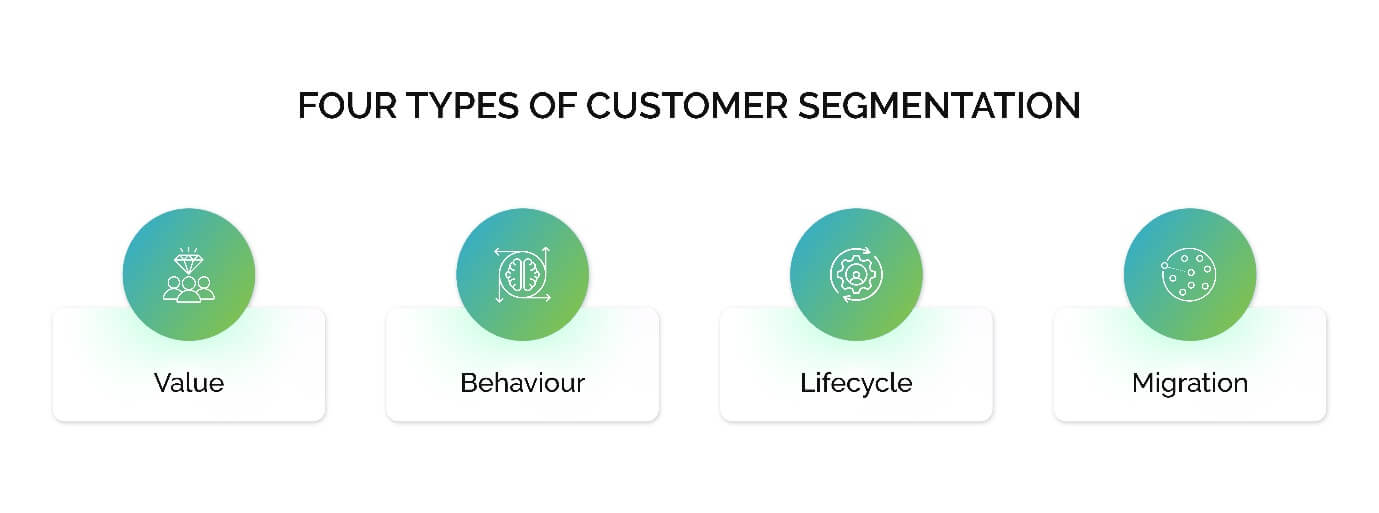
- Customer Segmentation Insights
- Regional Performance Analysis
Interactive dashboards transform static reports into decision-making tools.
4. Key Business Insights
Through data exploration and visualization, several important patterns emerged.
- Revenue concentration among a small group of products
- Seasonal sales fluctuations
- High-value customer segments
- Underperforming product categories
- Regional differences in purchasing behavior
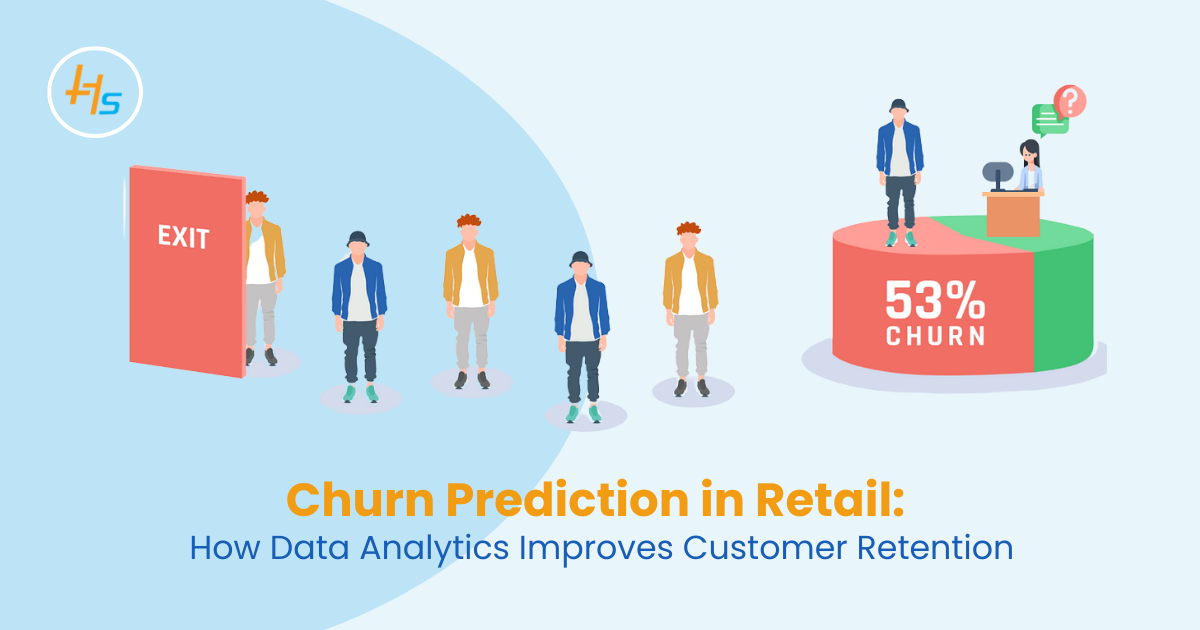
These findings created opportunities for inventory optimization, targeted marketing campaigns, and customer retention strategies.
5. KPI Framework
To measure business performance effectively, the dashboard focused on several key metrics.
- Total Revenue
- Total Orders
- Average Order Value (AOV)
- Gross Profit
- Customer Lifetime Value
- Repeat Purchase Rate
- Top Product Contribution
What gets measured gets managed.
6. Business Impact
By centralizing business metrics into a single dashboard, stakeholders gained immediate visibility into performance.
- Faster decision-making
- Improved inventory planning
- Enhanced marketing effectiveness
- Better customer targeting
- Greater operational transparency
The dashboard reduced reporting time while increasing the accessibility of business insights across departments.
7. Conclusion
SQL and Power BI together create a powerful analytics ecosystem for modern e-commerce businesses.
SQL provides the structure and reliability needed for data preparation, while Power BI transforms that data into meaningful business insights.
The goal of analytics is not reporting data — it is enabling smarter business decisions.